Results & Reporting
This page captures the modeling outcomes, workforce optimization feasibility, and the final dashboard deployment used to translate these forecasts into operational staffing decisions.
Executive Summary
- Forecasting Excellence: The Short-Term forecasting model (< 7 Days) achieved highly accurate results (WMAPE: 3.11%), driven predominantly by immediate autoregressive signals. The Long-Term ensemble (>= 7 Days) effectively captured macro-seasonal trends with a WMAPE of 13.12%.
- Optimization Feasibility: The abandonment-aware workforce optimizer successfully found feasible staffing solutions for 100% of the tested half-hour intervals (April 14-18, 2025), keeping average wait times under 5 seconds while maintaining occupancy targets.
- Operationalization: An end-to-end Workforce Management Dashboard has been deployed, allowing managers to monitor SLA compliance, run performance simulations, and interactively schedule shifts based on model outputs.
Metrics Dashboard
| Date | Model/Version | Dataset | Metric(s) | Result | Notes |
|---|---|---|---|---|---|
| 2025-11-15 | Short-Term LGBM (< 7 Days) | Sequential Test | WMAPE / R² | 3.11% / 0.9979 | Driven by lag features & weekly cyclicality. |
| 2025-11-15 | Short-Term LGBM (< 7 Days) | Sequential Test | MAE / RMSE | 28.55 / 58.88 | Highly sensitive to preceding 30-min volume. |
| 2025-11-15 | Long-Term Ensemble (>= 7 Days) | Sequential Test | WMAPE / R² | 13.12% / 0.9706 | Relies on historical averages & YoY baselines. |
| 2025-11-15 | Long-Term Ensemble (>= 7 Days) | Sequential Test | MAE / RMSE | 120.25 / 220.71 | Captures macro-seasonal/operational states. |
| 2025-04-18 | WFO Binary Search | April 14-18 Vol | Feasibility | 100% | Found solutions for all 120 half-hour intervals. |
Workforce Optimization Results
The optimizer was evaluated over the work week of April 14, 2025, through April 18, 2025. Under the default constraint set (SLA target = 0.80, Wait Time limit = 60s, Occupancy cap = 0.85):
- SLA Compliance: Mean predicted compliance was 99.85% (minimum interval-level SLA of 90.66%).
- Wait Times: Mean predicted wait time was 0.07 seconds (maximum interval-level wait time was 4.19 seconds).
- Agent Occupancy: Tightly bounded between 83.47% and 84.97%.
Constraint Sensitivity Analysis The optimizer’s sensitivity to the occupancy constraint was tested by varying the occupancy cap:
- Relaxing the cap from 0.85 to 0.90 reduced total agent-slots required by ~5.6%.
- Tightening the cap from 0.85 to 0.75 increased staffing requirements by ~13.3%.
Workforce Management Dashboard & Visualisations
Interactive dashboard components translate our forecasts and queueing models into actionable staffing decisions.
1. Main Dashboard
The dashboard provides a high-level overview of operational performance, forecasted demand, and workforce activity for rapid situational awareness.
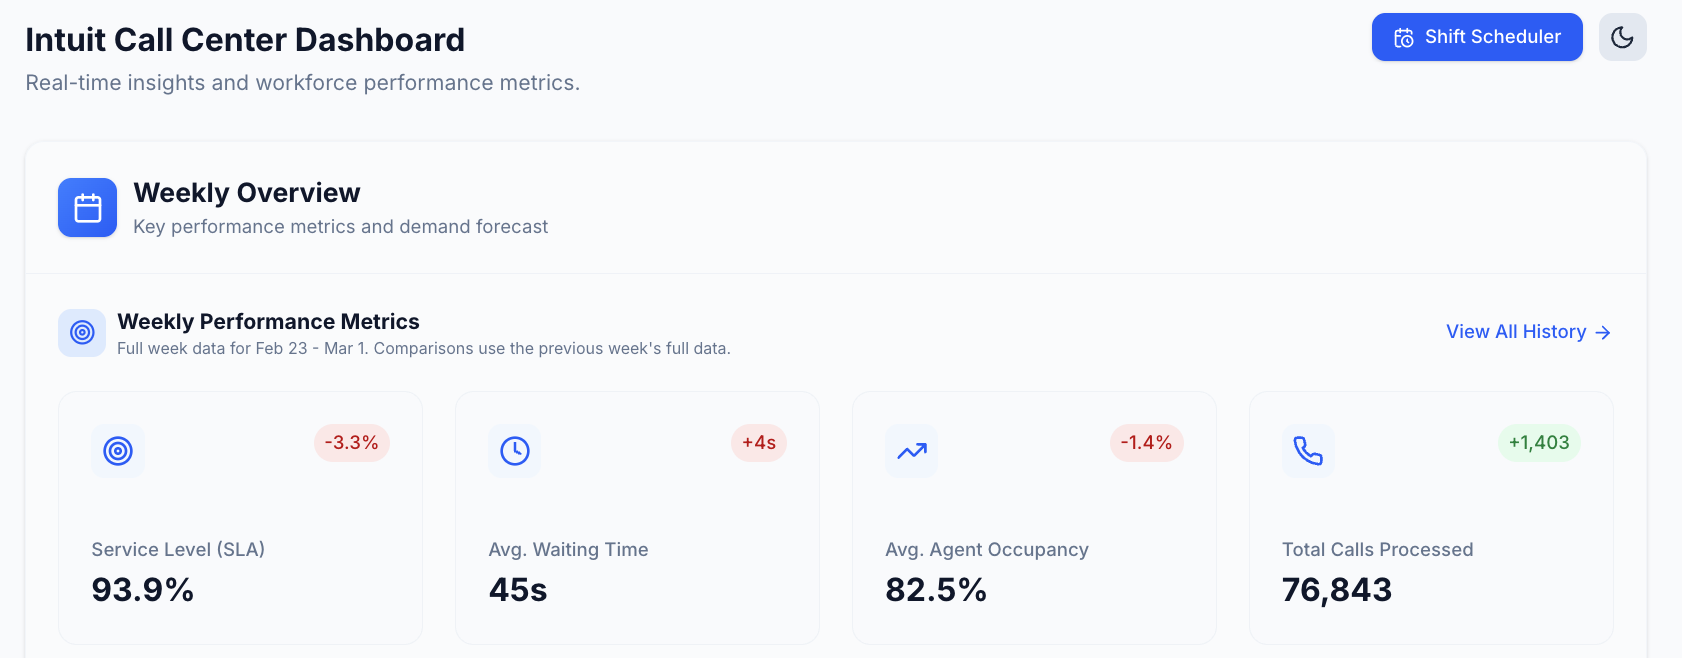 Figure 1: Main dashboard interface showing weekly performance metrics, demand forecast, and agent productivity summary.
Weekly Overview & Forecasts Dynamically calculates week-to-date SLA, average wait times, occupancy, and total calls. It displays a seven-day forecast bar chart differentiating past, current, and future days.
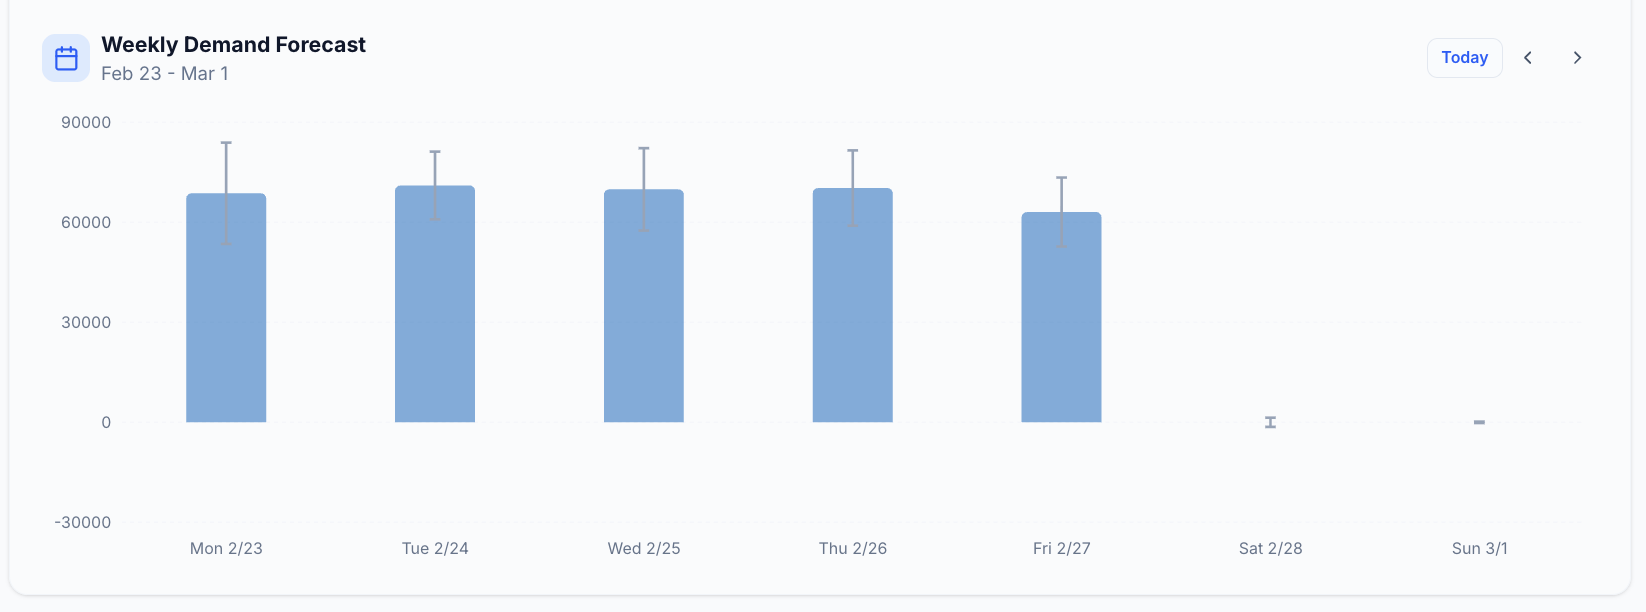 Figure 2: Weekly call demand forecast visualized across the seven days of the selected week.
Top Performing Agents Highlights individual productivity with real-time status, calls handled, handle time, and utilization rates.
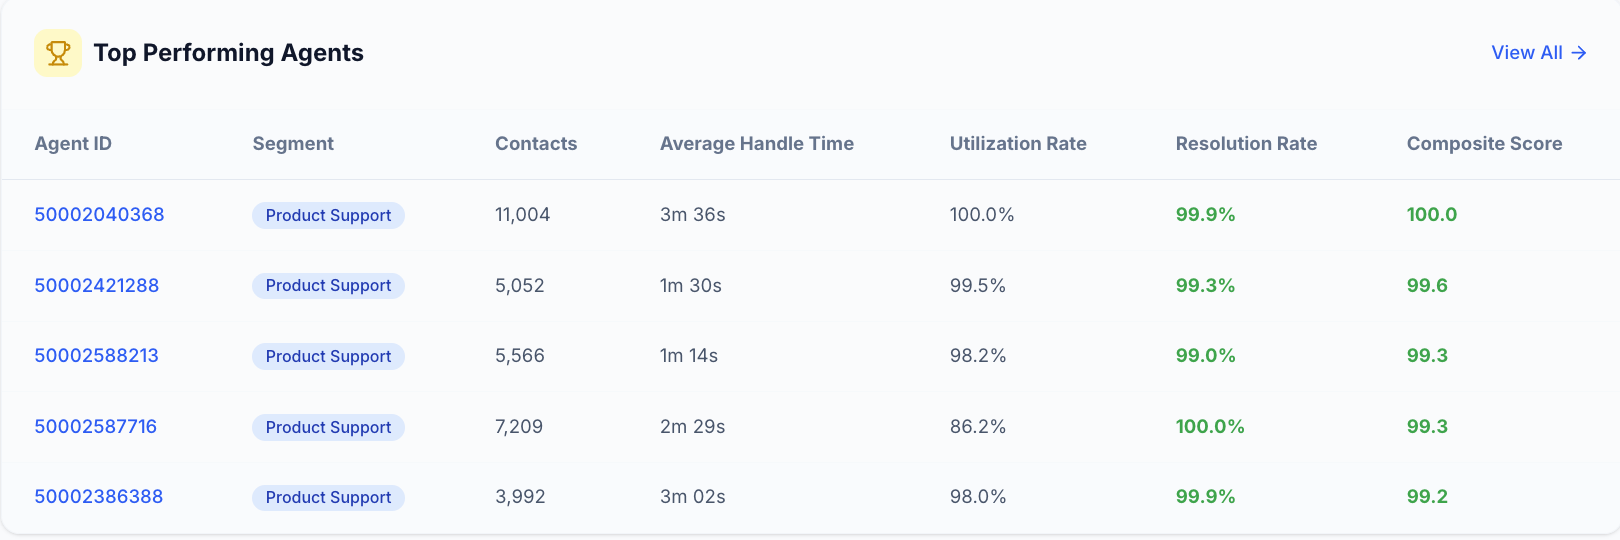 Figure 3: Top-performing agents table displaying real-time status and productivity metrics.
2. Performance Simulator
An interactive environment for evaluating staffing requirements under different operational targets, integrating demand forecasts with Erlang-based queueing calculations.
Target Metrics Configuration Managers can use slider controls to adjust SLA targets, maximum waiting time thresholds, and occupancy limits to evaluate alternative strategies in real-time.
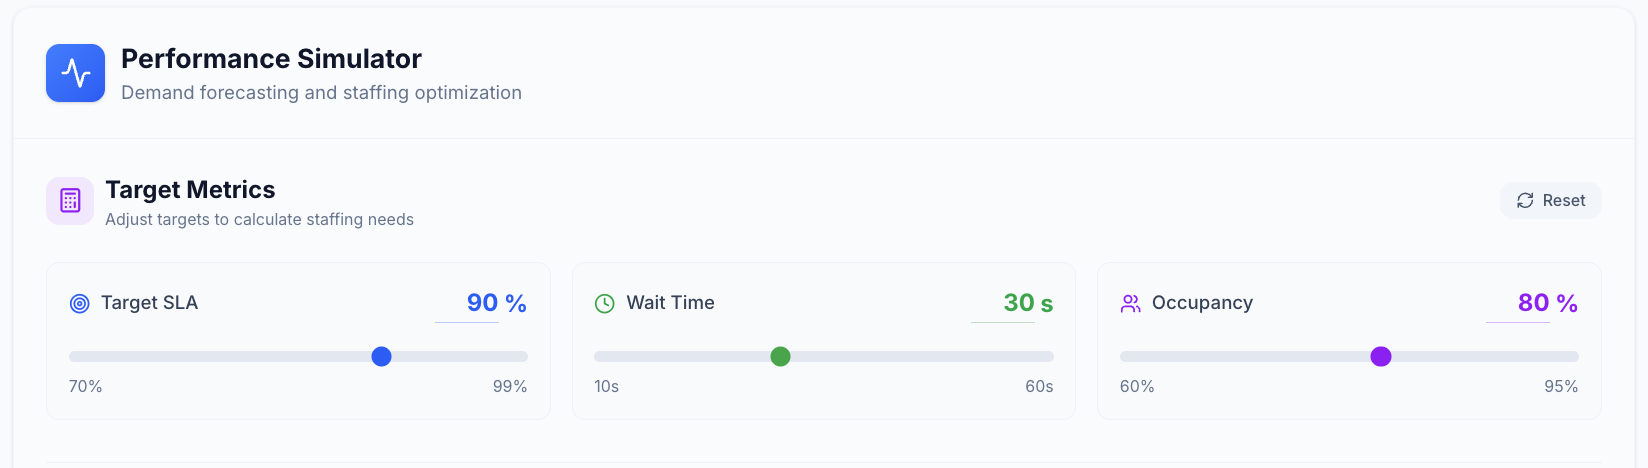 Figure 4: Performance simulator controls allowing managers to adjust SLA, waiting time, and occupancy targets.
Daily Demand and Staffing Forecast Visualizes predicted call volume (area chart) and required staffing (bar overlay) at a 30-minute granularity over a 24-hour period.
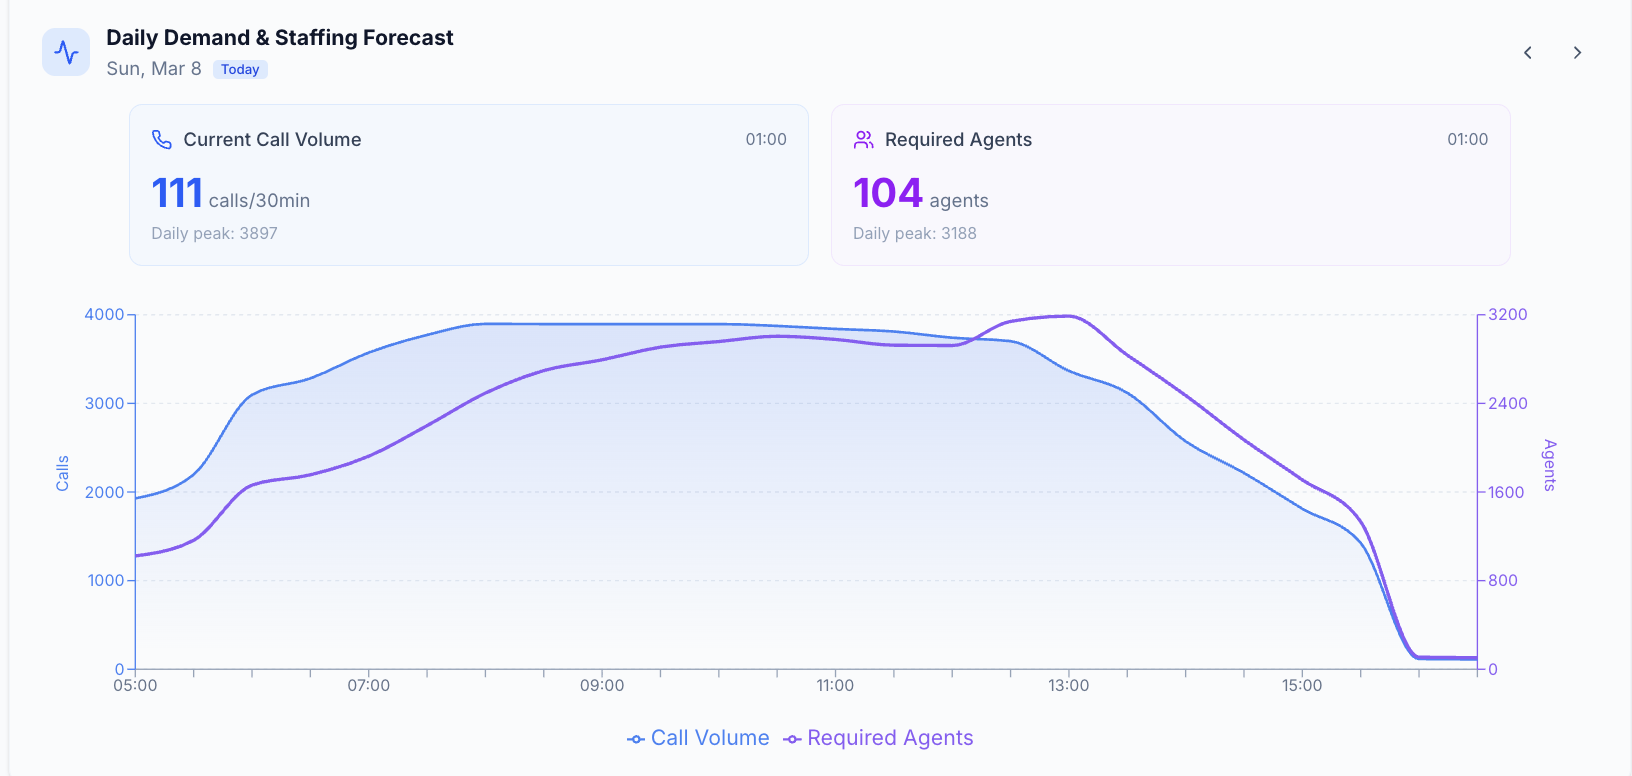 Figure 5: Daily demand and staffing forecast visualization at 30-minute granularity.
3. Shift Scheduler
Translates predicted staffing requirements into operational shift assignments while respecting workforce constraints.
Overview & Metrics Users select the week/day via an interactive calendar to view coverage summaries, available agents, staffed time slots, and schedule completion status.
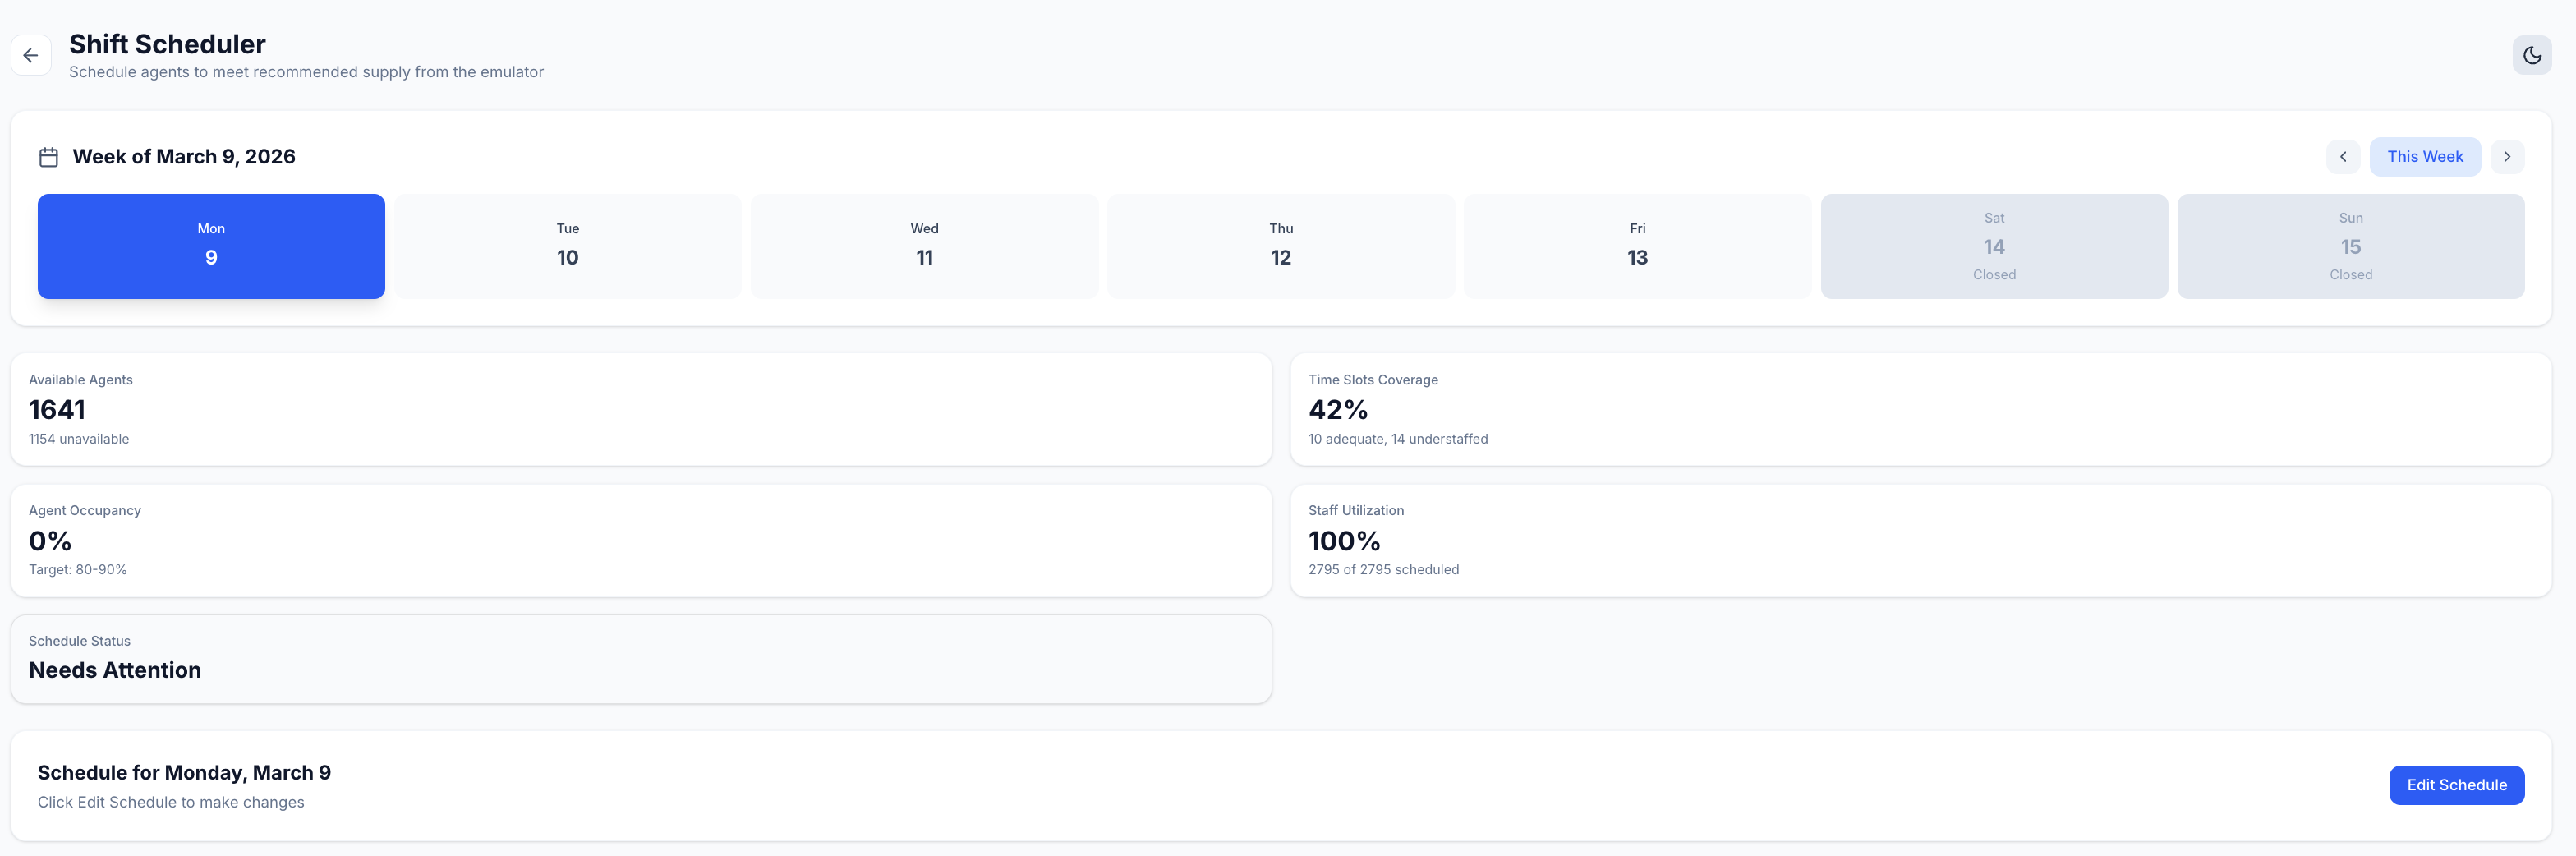 Figure 6: Shift scheduler overview showing week and day selection, staffing coverage summary metrics, and schedule editing controls.
Interactive Timeline & Agent Assignment A 24-hour timeline allows managers to drag blocks to create shifts. Managers can drag agents directly from the availability lists onto the timeline. Schedules automatically lock once the date begins.
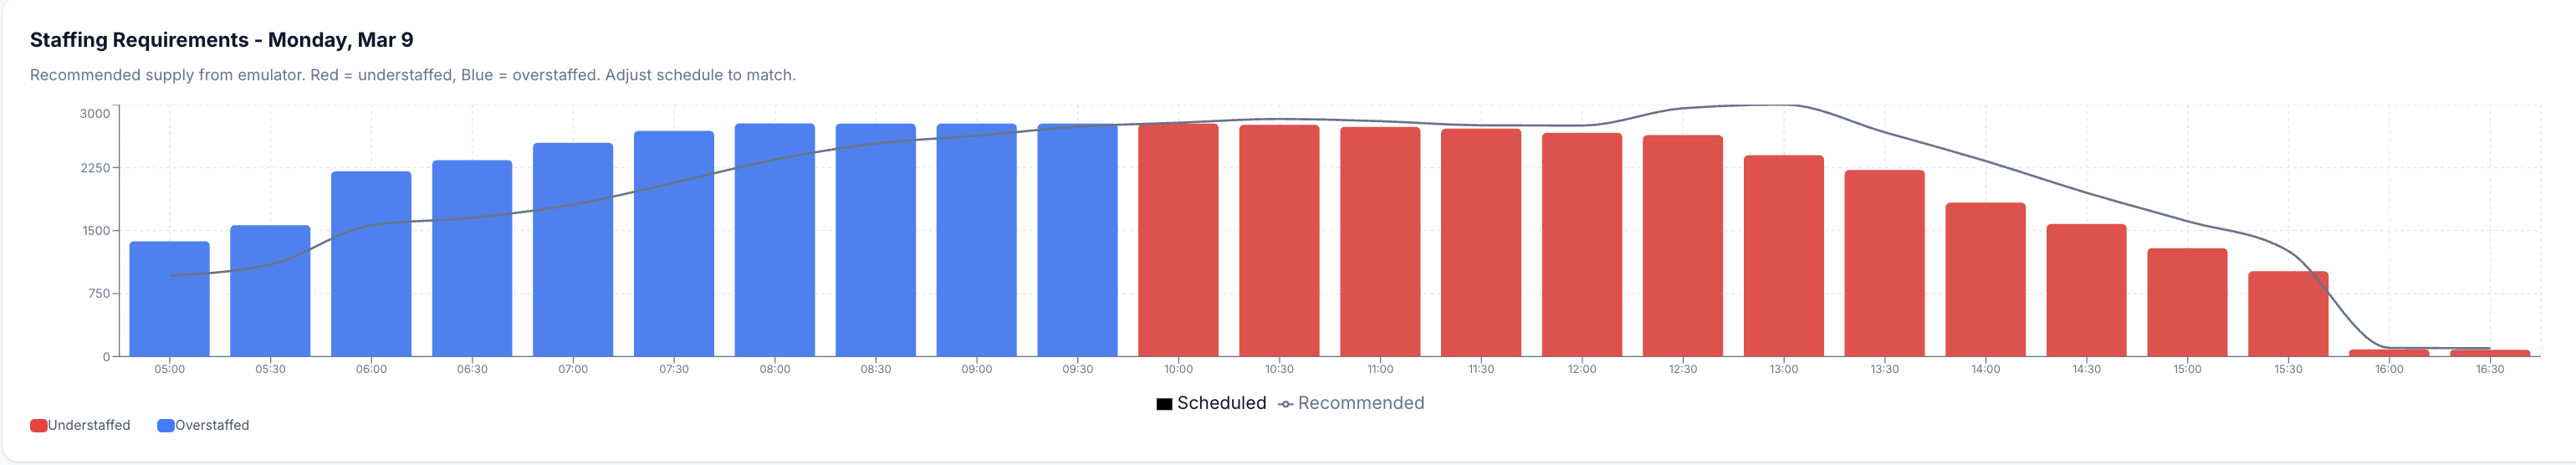 Figure 7: Interactive shift scheduling timeline showing agent shifts and required staffing levels.
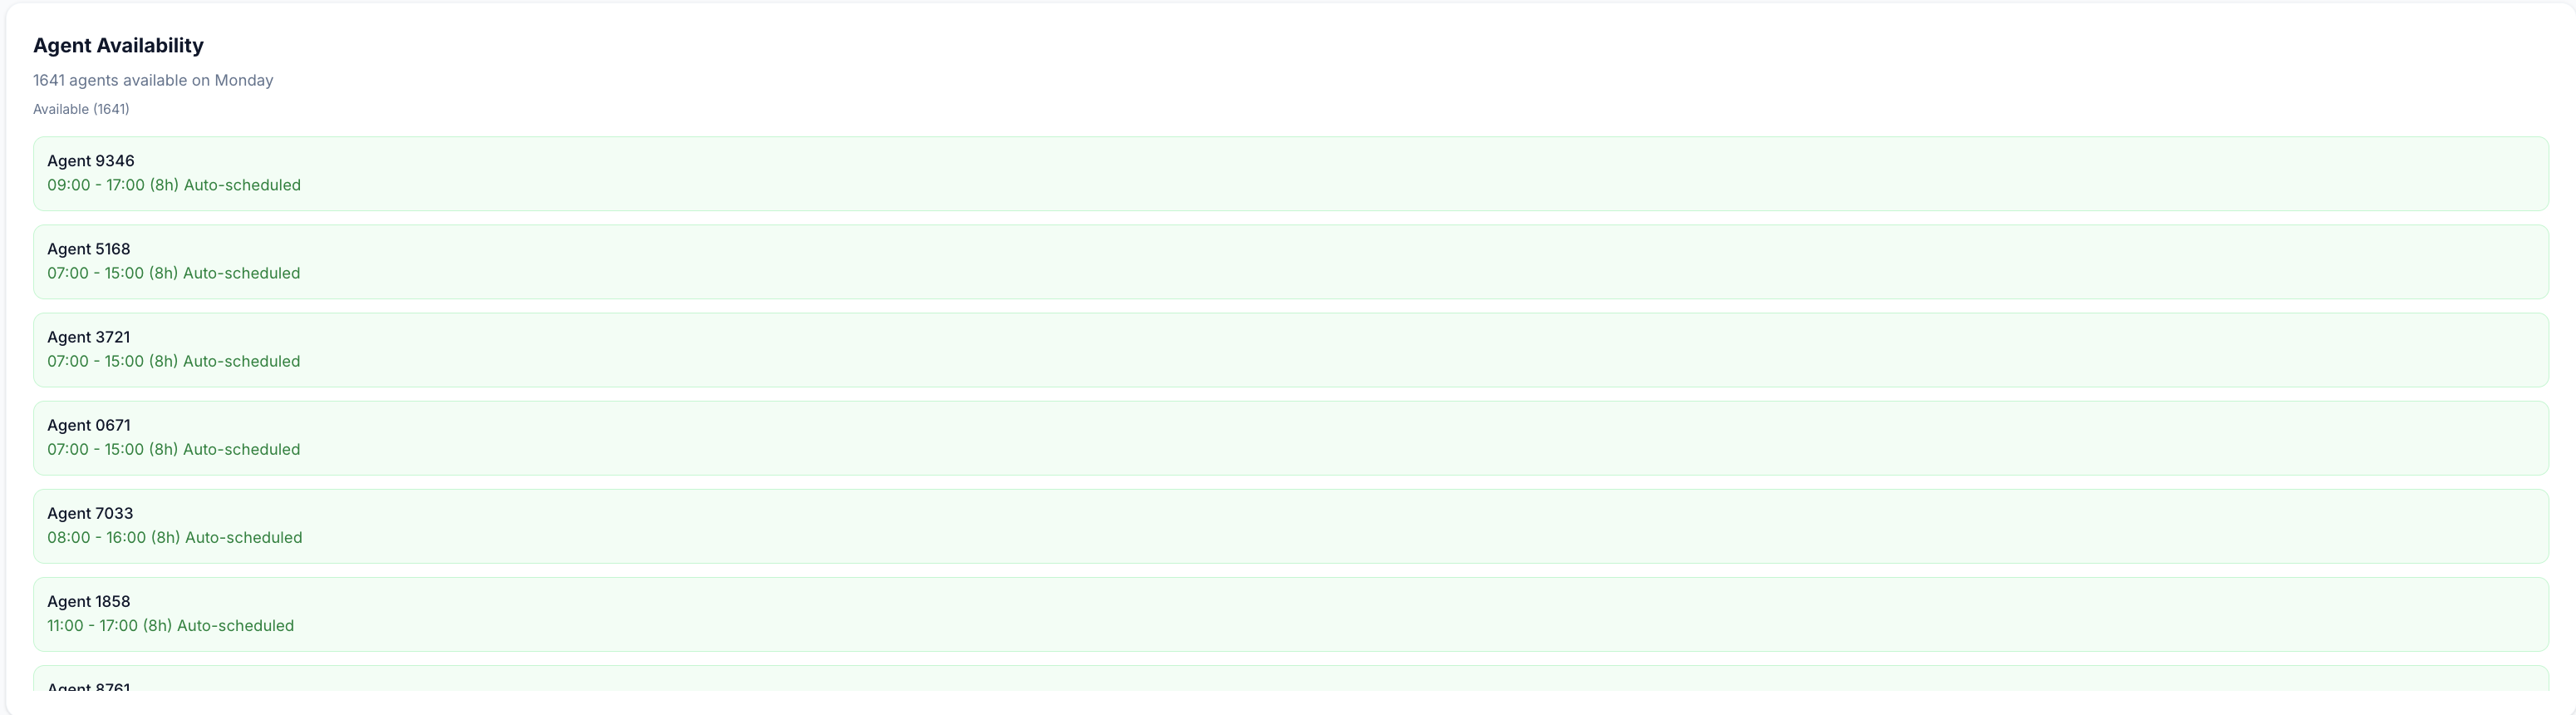 Figure 8: Available and unavailable agent lists used for shift assignment.
Narrative Reports & Stakeholder Communication
- Methodology Handover: The comprehensive modeling pipeline and queuing theory mathematics have been documented in the Methods tab.
- Tooling Access: The UI is currently deployed for Call Center Shift Managers.
- Status Updates: Weekly syncs are held with the Operations steering committee to review forecasting accuracy and schedule adherence.
Next Steps & Open Questions
- Model Drift Monitoring: Establish automated alerts if the Short-Term model’s WMAPE degrades beyond 5% for three consecutive days.
- User Adoption: Track manager engagement with the Performance Simulator to ensure the binary search outputs are trusted over legacy heuristic scheduling.
- Feature Expansion: Investigate incorporating real-time shrinkage (unplanned absences) into the immediate intraday autoregressive forecast.